As of the end of Q3 2015, there were 50,228 drives spinning in the Backblaze datacenter. Subtracting boot drives, drive models with less than 45 drives and drives in testing systems, we are publishing data on 49,056 hard drives spread across 26 different models, varying from 1.0TB to 8.0TB in size...Read more
Hard Drive Failure Rates
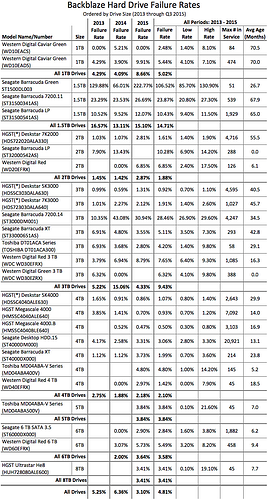
There’s a lot going on in the chart above, here are a few things to help out:
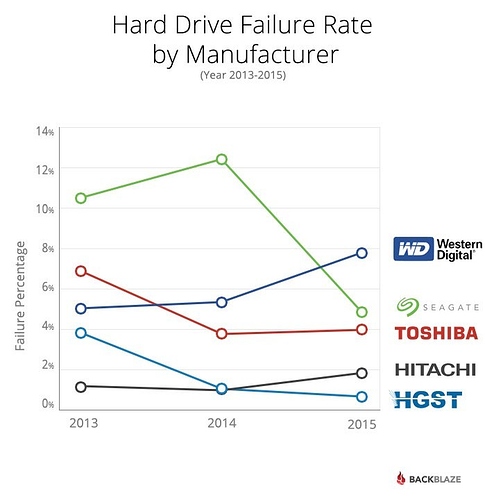
The 2013, 2014, and 2015 failure rates are cumulative for the given year. In the case of 2015 that is through Q3 (September).
If the failure rate is listed as 0.00% there were drives in use, but
none of the drives failed during that period.
If the failure rate is blank, there were no drives in use during that period.
- The “All Periods” failure rates are cumulative for all data (2013-Q3 2015).
- The “Max # in Service” column is the maximum number of drives ever in service for the given hard drive model.
- The “Avg Age (Months)” column is the average age of all the hard drives of the given hard drive model. This is based on SMART 9 data.
- If the “Avg Age (Months)” data is 0.0, the given drive model was not in service during 2015 making the value difficult to compute. (We’ll try to figure out a better way to compute this value by the next report.)
- The HGST (*) model name – we’ve been asked to use HGST in place of Hitachi and we are honoring that request, but these drives report their model as Hitachi and are listed as such in the data files.
- The Low Rate and High Rate are the boundaries for the confidence interval for the failure rate listed.